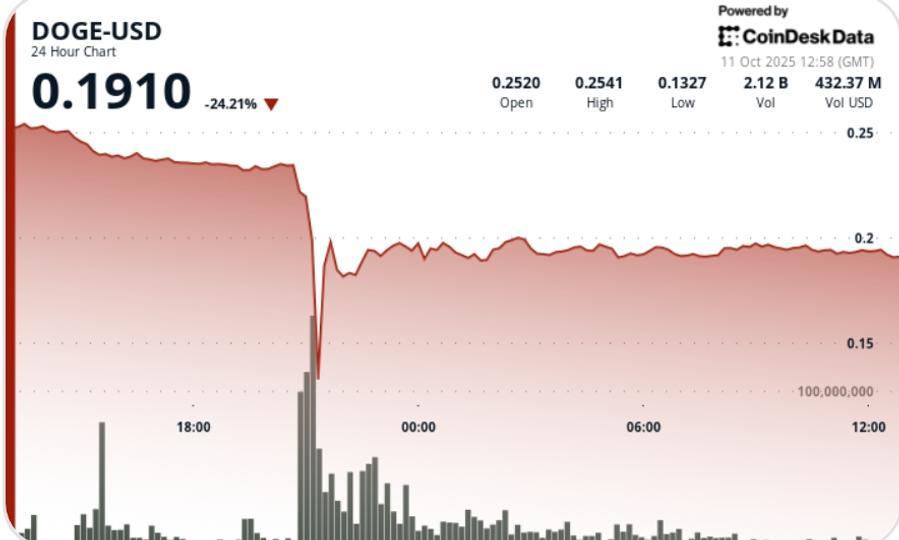
Dogecoin crashed 50% on Friday evening in a rare flash crash that saw the price plunge from $0.22 to $0.11 in a matter of minutes before rebounding to the $0.19 to $0.20 area.
What you need to know
• DOGE fell from $0.22 to $0.11 at 9:00 p.m. UTC on October 10 – a 50% flash crash followed by a recovery to between $0.19 and $0.20.
• Total intraday range = $0.14 (volatility ≈57%), with 4.6 billion tokens traded compared to 1.5 billion daily average.
• The Trump administration’s announcement of 100% tariffs on Chinese imports triggered greater crypto risk aversion.
• End of session trading showed a re-accumulation of whales; foreign exchange outflows exceeded $23 million and 2 billion DOGE was added to corporate wallets.
• 21Shares has launched its institutional DOGE ETF (TDOG), providing the first regulated exposure to the asset.
News context
The move came hours after President Trump’s tariff hike sparked a market sell-off, affecting both stocks and digital assets. DOGE briefly traded at $0.11 on Bitfinex before stabilizing above $0.19 thanks to the intervention of liquidity desks. Market chatter has linked the collapse to leveraged liquidations and automated multi-venue arbitrage failures rather than fundamental deterioration. Institutional demand resurfaced around $0.19, aided by ETF flows and whale offerings replenishing long exposure.
Price Action Summary
• Flash crash at 9:00 p.m. UTC: DOGE $0.22 → $0.11 (-50%) on volume of 4.6 billion.
• Recovery to $0.19-0.20 within hours as whales absorb supply.
• Follow-up sale observed at 11:18 UTC Oct 11 ($0.1935 → $0.1916, -4%), volume 32 million.
• A session range of $0.14 (57%) marks the highest volatility of the year for DOGE.
• Last hour consolidation near $0.193 signals cooling but no trend reversal yet.
Technical analysis
• Support – Formed between $0.19 and $0.20 as institutional flows absorbed panic selling.
• Resistance – Immediate barrier to pre-crash high of $0.22; above that, the next targets are $0.25 and $0.30.
• Volume – Peak 4.6 billion versus 2.0 billion 30-day average; capitulation turnover.
• Pattern – A double bottom near $0.19 could mark an accumulation zone.
• Momentum – Oversold RSI and expanding Bollinger Bands suggest near-term mean reversion.
What traders are watching
• Will $0.19 provide a reliable floor of support or spark another wave of liquidation?
• Can ETF flows and institutional accumulation offset broader macroeconomic risk?
• Whales adding ≈2 billion DOGE — signal to buy value or exit the liquidity trap?
• Volatility patterns after a price shock: Does DOGE return to the 0.25-0.30 range or languish below 0.20?
• Confirmation of the reconstruction of the triangle above $0.22 would invalidate the bearish structure.


