XRP fell below the $2.50 support during Tuesday’s session, sliding 5% to $2.47 as institutional selling pressure accelerated on major exchanges. The breakdown confirmed a decisive shift in structure after weeks of tight consolidation, with volume and chart patterns now aligning towards a deeper corrective phase.
News context
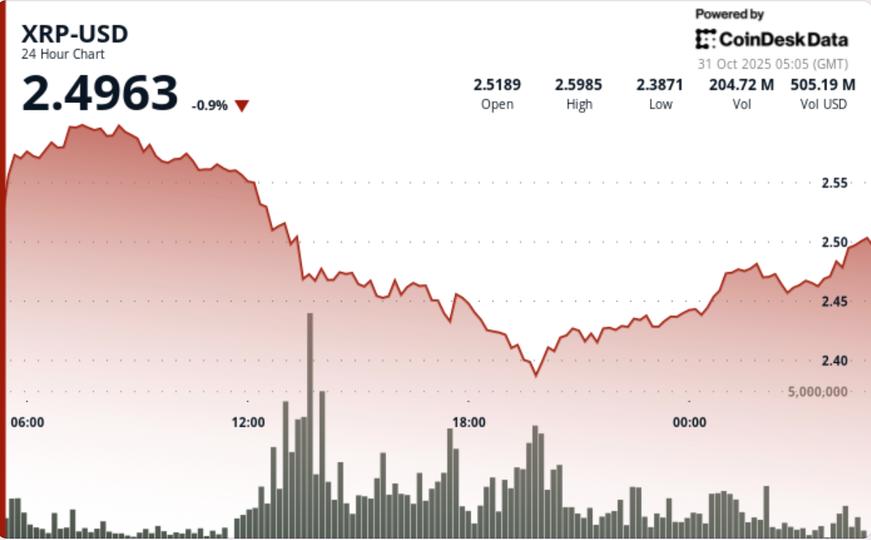
- The token’s 24-hour session saw prices drop from $2.60 to $2.47, marking one of the biggest one-day declines this month.
- The breakout of the psychological $2.50 level triggered a wave of algorithmic and institutional selling, propelling trading activity to 169 million tokens, up 158% from the 24-hour average.
- The XRP market’s underperformance contrasts with broader crypto strength, suggesting a rotation into altcoins as risk appetite cools amid dwindling speculative participation.
- The breakout reinforced strong overhead resistance at $2.60, where repeated rejection points in recent weeks had limited upside momentum.
Price Action Summary
- The selling took place in structured phases throughout Tuesday’s session. The initial breakdown began at 1:00 p.m. UTC, when heavy selling volume pushed the price decisively through the $2.50 support, triggering a cascade that extended to an intraday low near $2.38.
- Subsequent price stabilization formed around the $2.43 to $2.46 range, suggesting the early stages of a potential consolidation base.
- Short-term momentum readings indicated exhaustion as volume declined toward the close, momentum often preceding intermediate breaks in the downtrend.
- On a microstructural level, 60 Minutes data showed two distinct distribution waves as XRP moved from $2.472 to $2.466.
- Successive hourly volume peaks of 2.8 million and 2.6 million tokens, each exceeding 300% of hourly averages, confirmed continued institutional control over intraday flows.
Technical analysis
- XRP’s collapse marks the continuation of its lower-high-lower pattern that began after the $2.60 resistance failed to retest.
- The session’s 8.8% volatility range highlights aggressive liquidation and profit-taking by larger holders, aligning with recent on-chain signals of FX inflows.
- Momentum indicators such as the RSI have moved into neutral to bearish territory, while the MACD shows increasing bearish divergence. The $2.40 to $2.42 area now acts as immediate technical support, and a close below this band could pave the way for a further decline towards $2.30 to $2.33.
- Volume analysis remains crucial: the 169 million turnover during the outage confirms institutional participation rather than retail panic, while the decline in activity at the end of the session implies that the bulk of distribution may already be complete.
What traders should watch out for
- Traders are closely watching whether $2.43-$2.46 can move into a stable accumulation zone or whether a sharp break below $2.40 accelerates capitulation.
- It would be necessary to reclaim the $2.50 level to neutralize the short-term bearish momentum and reestablish a constructive setup targeting $2.60.
- Until then, rallies toward resistance will likely face supply from trapped long-term investors and short-term profit-takers.
- Overall sentiment remains cautious amid a risk-averse rotation, with derivatives positioning showing a decline in open interest and an uptick in short exposure in perpetual futures markets.


