Bitcoin On Tuesday, it briefly fell below $100,000 for the first time since June, hitting a low of around $98,951. The decline brought the largest cryptocurrency below two key support levels needed to sustain the current bull market, fueling fears that the decline could deepen.
The two levels, the 365-day simple moving average (SMA) and the 365-day exponential moving average (EMA), are currently at $102,055 and $99,924, respectively. Both have already been tested during this bull cycle.
In August 2024, Bitcoin used the 365-day SMA, the average closing price over that period giving equal weight to each, as a key support level around $48,963, while briefly falling below the price EMA, giving more weight to recent readings. Then, during the April “tariff crisis,” bitcoin fell all the way to $76,500, falling below both moving averages before recovering them shortly after.
Where does the selling pressure come from?
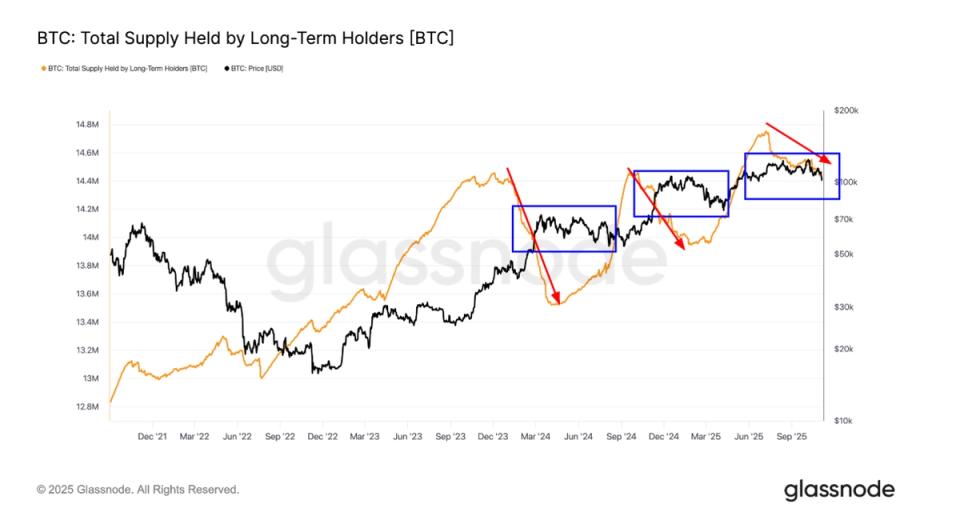
Selling pressure continues to come from long-term holders, defined as investors who have held their bitcoin for at least 155 days. The supply held by this cohort now stands at around 14.4 million BTC, up from over 14.7 million BTC at the July peak.
This is the third notable wave of sales from this group since late 2023. Each time, additional downward pressure has led to price consolidation or even corrections – declines of 10% or more – after a period of rising prices. The previous example occurred at the November 2024 rally following President Trump’s election victory.


