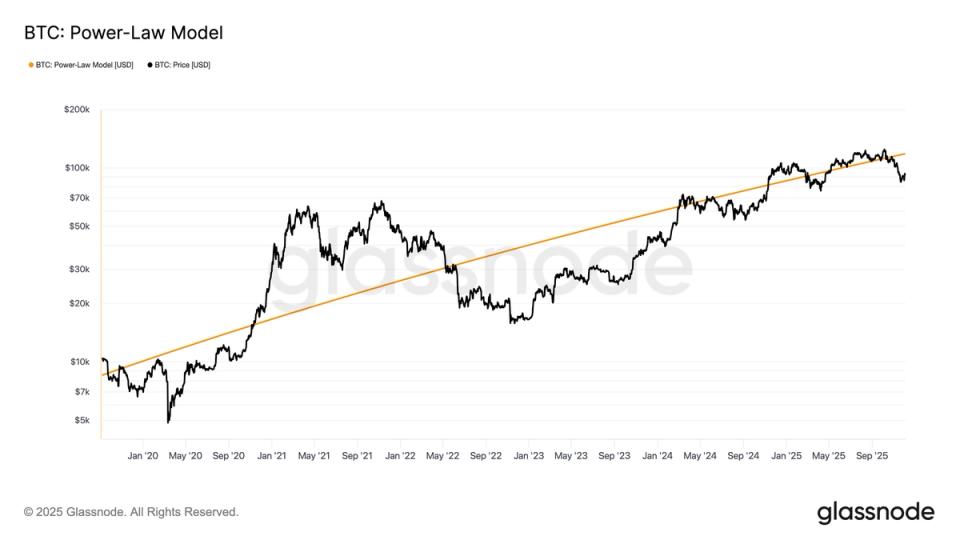
Over a fairly long period of time, all long-term bitcoin valuation models were eventually broken, but the one that maintained the strongest narrative of this cycle was the power law model.
Historically, in previous cycles, bitcoin has tended to exceed this pattern during bull markets and fall below it during bear markets, but in the current cycle, the price has largely remained close to the pattern’s trajectory.
Bitcoin’s power law framework provides a mathematical perspective on long-term price trends, revealing that bitcoin’s historical performance follows a power law distribution on a logarithmic scale. This implies a relationship between time and price. However, the model relies on historical observations.
In theory, it is a retrospective model and does not guarantee the accuracy of future forecasts, particularly given the unpredictable nature of financial markets. The model is useful for understanding long-term structural trends.
Below $90,000, bitcoin is currently trading at a sharp discount to the pattern. The power law value sits near $118,000, putting the spot price approximately 32% below the model. This is the largest gap since the end of the yen carry trade in August 2024, which produced a 35% deviation from the trendline and took three months to recover.
From a broader perspective, Bitcoin has spent most of this cycle moving closer to the pattern, whereas in previous cycles it has deviated much more aggressively above and below it.
During the last cycle, the most prominent model was the stock-to-flow framework created by anonymous analyst Plan B, which assumes that scarcity directly determines value. The model is no longer valid as of January 2021 and, according to current Glassnode data, this would imply a price of around $1.3 million per bitcoin today.
The key question now is whether the bitcoin average will return to the power law trend or whether it will collapse and call into question the validity of another long-standing pattern.


