On Friday, many traders were watching the price action of Bitcoin (BTC) during European hours, slightly confused and for good reason.
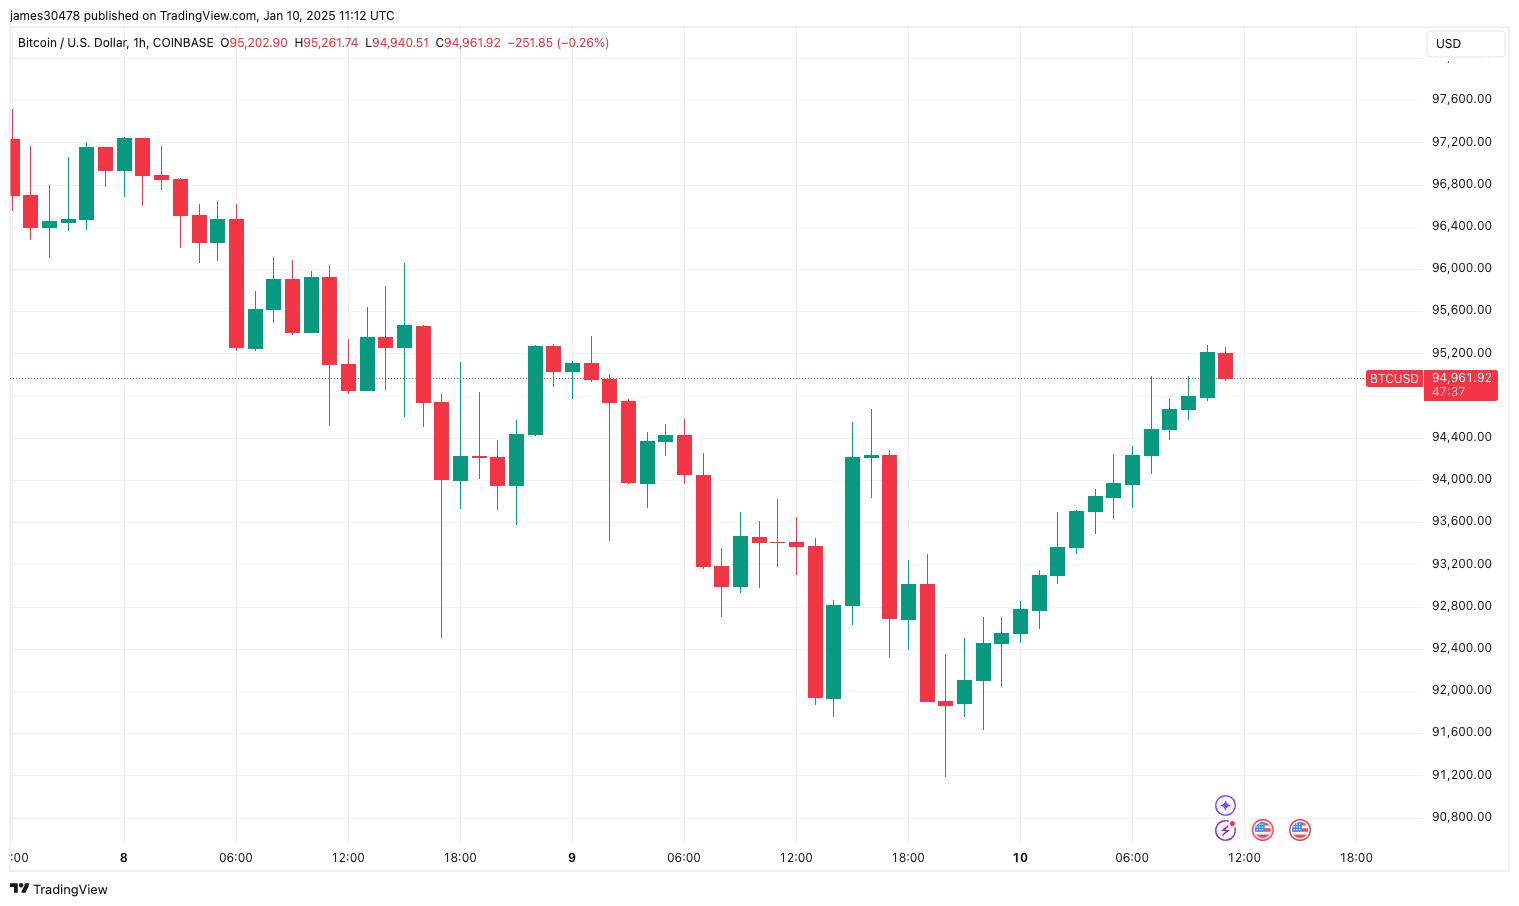
If you look at the BTCUSD candlestick chart on Coinbase, you will see fourteen green hourly candles, which means that over the last 14 hours, Bitcoin has been making gains every hour.
The hourly candles come as BTC price rose from $91,771 to $95,283. The trend started on January 9 at 21:00 UTC and continued until 10:00 UTC on January 10.
The unusual price chart has left traders on X perplexed.
Vetle Lunde, principal analyst at K33 Research, has gathered data on when this last happened. This is currently the longest hourly streak of green candles since at least January 1, 2017, when it had 11.
But this isn’t the first time we’ve seen double-digit hourly green candles lately. Bitcoin charts showed similar trends on January 14, 2023 (11), February 26, 2024 (11), and November 12, 2024 (11).
The fifteenth hourly candle is currently red, potentially ending this trend and is expected to end at 12:00 UTC.


