Bitcoin Last week’s 11% drop may be the least of investors’ concerns. That’s a price of around $58,000, or another 25% below current levels, that they should pay attention to.
Although the largest cryptocurrency’s recent crash, the biggest weekly decline since March 2025, and the failure to attract buyers have many holders worried about another so-called crypto winter, there is still a painful journey before reaching the eventual glimmer of hope that is the 200-week moving average (WMA).
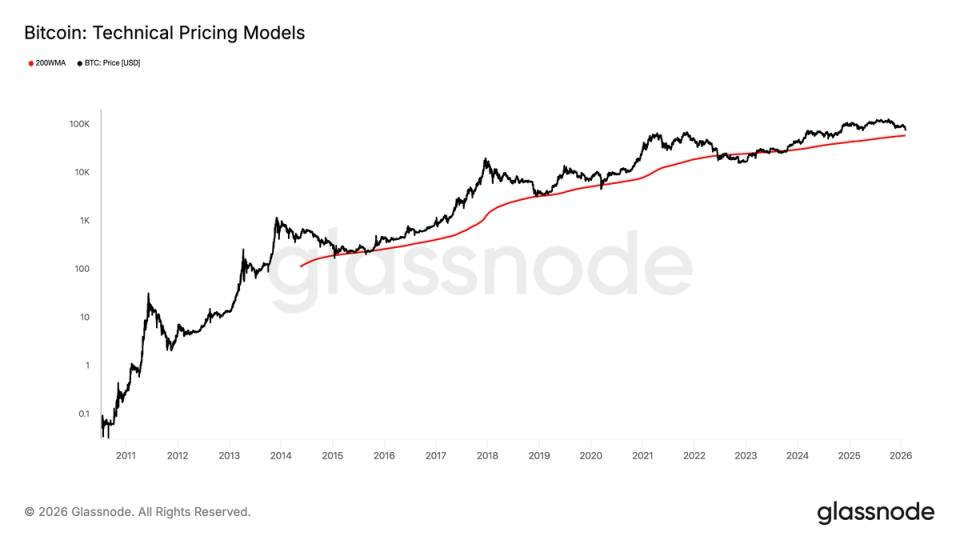
The average closing price of BTC over the past 200 weeks is a widely used long-term momentum indicator and a benchmark for the traditional four-year Bitcoin cycle. It marked a market low during each previous cycle and currently sits at $57,926.
Historically, bitcoin has often peaked in the fourth quarter of the fourth cycle. This time around, it hit an all-time high of $126,000 in October and is currently down about 40% from that high.
Another slide could be considered.
Last week’s decline brought Bitcoin under the Ichimoku cloud, a technical indicator that gauges momentum, support and resistance. When price holds above the cloud, it indicates a robust uptrend, with strong upward momentum. When the price falls below this threshold, the market becomes anemic, lacking strength and exposed to prolonged weakness, like a human body running out of iron.
Bitcoin just moved below the cloud on the weekly chart, a bearish move that has historically marked the start of the deepest and most painful bear market phases.
It also appears to broadly follow the four-year cycle theory, driven by the halving schedule which reduces new supply by 50% approximately every four years and which partly explains cyclical bull and bear markets.
During the 2015 bear market, bitcoin traded slightly above $200 and consistently used the 200-WMA as support. During the 2018-2019 bear market, 200-WMA sat just above $3,000 and served as support again, with a brief breakout during the Covid-induced stock market crash of March 2020.
During the previous cycle, bitcoin fell below the 200-WMA in June 2022, to levels below $22,000, and remained there for an extended period. Price only reclaimed the 200-WMA line in October 2023, confirming its role as a long-term trend support line.
While there are no guarantees, the recent price decline below the Ichimoku Cloud indicates that another phase of sustained bear market may be imminent, but at least there is a proven support level to give some cheer.


