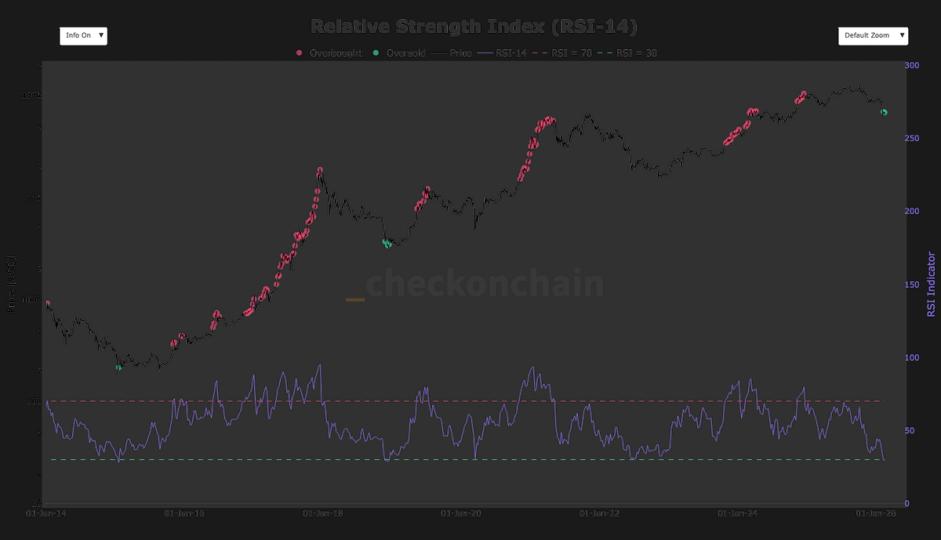
Bitcoin’s 14-day relative strength index (RSI) fell below 30 for only the third time in its history this month, according to checkonchain.
The RSI is a popular tool for detecting an asset’s momentum by measuring the speed and magnitude of recent price movements and comparing average gains and losses over a defined 14-day period.
The index produces a reading between 0 and 100, with levels above 100 generally considered overbought, while readings below 30 indicate oversold conditions, suggesting that selling may be excessive. Bitcoin’s 14-day RSI has not reached 100 since December 2024, when Bitcoin first surpassed $100,000.
Previous readings below 30 marked prior cycle lows. In January 2015, bitcoin’s RSI fell to around 28 as the price approached $200. The market then spent about eight months consolidating before experiencing a lasting recovery. A similar trend appeared in December 2018, when the RSI fell below 30, around $3,500. This period was followed by approximately three months of sideways accumulation before bitcoin skyrocketed.
BTC is trading around $66,000, with sentiment stuck in “fear” or “extreme fear” on the Crypto Fear & Greed Index for much of the last 30 days. Since its October peak, bitcoin has lost more than 50%, briefly falling to $60,000.
History suggests that the current move could lead to consolidation around the $60,000 region in the coming months before the next leg up.


