The two things most cryptocurrency investors wonder about are how inferior bitcoin can be. go and how much longer this bear market could last.
The “price pain” aspect has been widely discussed, but the temporal dimension is another question in itself.
Price pain refers to sharp declines or volatility that force participants to exit their positions, while time pain reflects slow, limited conditions that exhaust both bulls and bears due to lack of direction.
Bitcoin is currently trading below $66,000, down more than 3% in the past 24 hours and about 45% below its all-time high from October, a nearly six-month bear market.
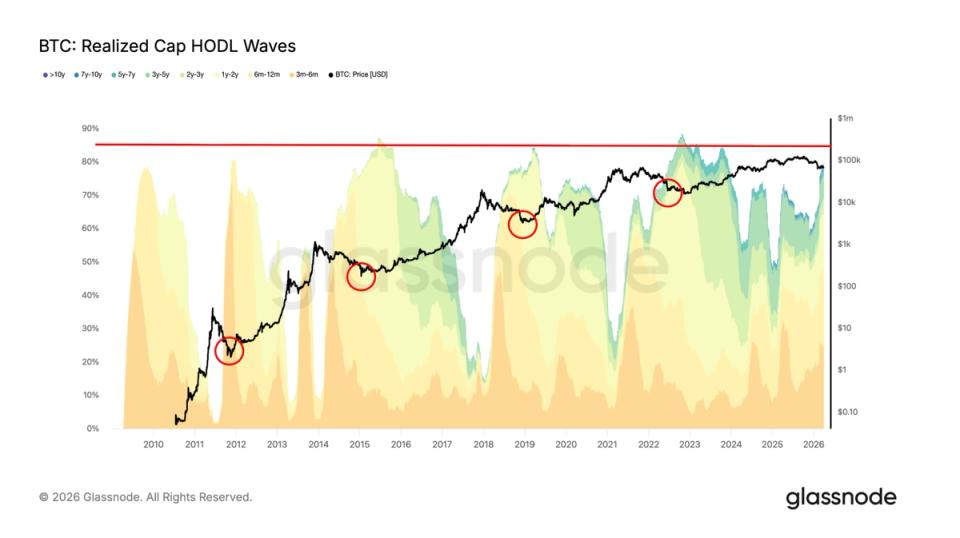
Cap HODL waves made from Glassnode are an indicator pointing to continued pain of time. This metric groups the bitcoin supply based on the coins’ last movement, with each band representing different holding periods, and weights them based on realized price, the average price at which the coins were last traded on-chain.
Historically, bear market troughs have coincided with long-term holders, those who have held their securities for six months or more, controlling at least 85% of the supply. Typically, the lowest prices form first, and it is not until several months later that the supply of long-term holders approaches these high levels, indicating that these investors bought at depressed prices and held on during the bear market.
Currently, long-term holders represent around 80% of the supply. If this trend continues, the market could approach a bottom phase, although several months of consolidation are likely still to come.


