Bitcoin continues to struggle during one of its strongest months in history, often referred to as “Uptober”, currently down more than 5% and trading below $108,000 as it approaches several critical support and resistance levels.
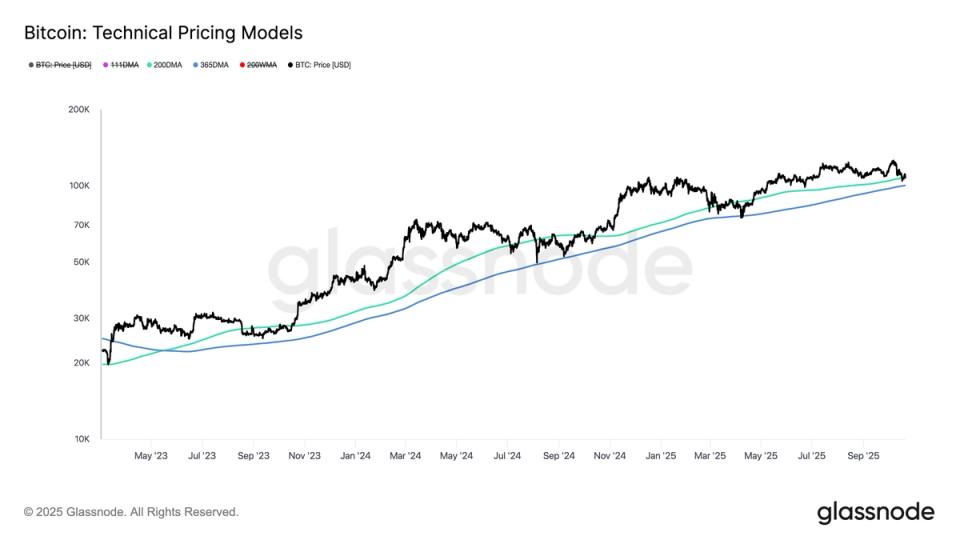
The 200-day simple moving average (200SMA), a key indicator that often separates bull and bear markets, now stands at $107,846 and is immediate resistance.
Since the start of the 2023 cycle, bitcoin has primarily held this level as support, but it fell below during the summers of 2023 and 2024 and again in April 2025. The 365-day SMA, which provides a broader view of long-term momentum and sits at $100,367, has historically served as secondary support when the 200DMA fails. This is the fourth time during this cycle that the Bitcoin price has been sandwiched between these two averages, a limited pattern that can last for months.
Additional key levels include $103,509, the average 2025 investor base cost according to Checkonchain data. This constitutes an important floor price, as well as a psychological support level of $100,000 that anchors market sentiment.
On the upside, $112,100 represents the short-term cost basis, which reflects the average on-chain acquisition price for coins moved over the past six months.
Historically, bitcoin has fallen below this level during corrections, but sustained trading above this level typically signals the resumption of a bull market.


