The crypto market is back in the spotlight after a two-week ceasefire between the United States and Iran lifted some of the geopolitical uncertainty and sent oil prices tumbling. However, the dynamics of the energy market are such that it may be too early to assume the return of animal spirits to risky assets.
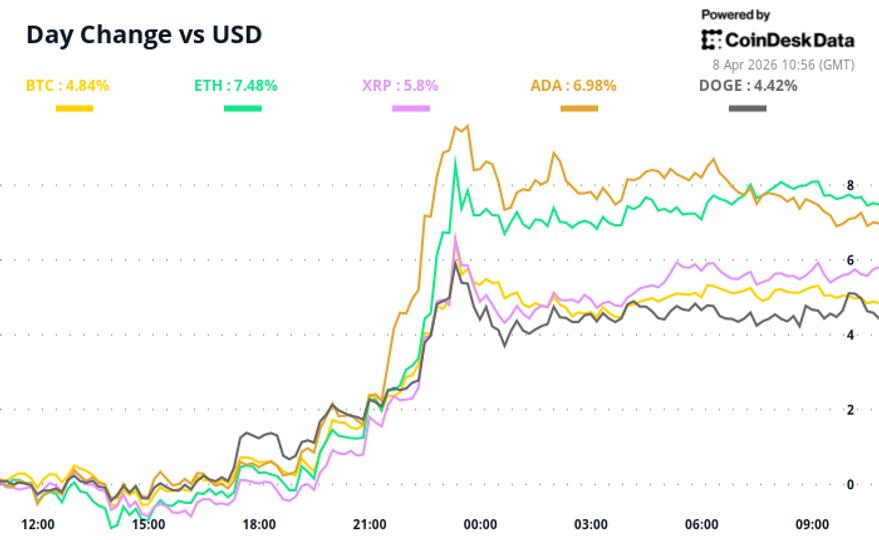
Bitcoin surged 3% to $71,600 in the past 24 hours, while ether (ETH), XRP (XRP), and solana (SOL) all gained more than 5%. The CoinDesk 20 Index outperformed bitcoin, rising 4.2%, which is typical when altcoins outperform the market leader.
Oil plunged after Iran agreed to open the Strait of Hormuz, a key route for global shipping. WTI crude futures on the NYMEX are down nearly 16 percent at $95 a barrel. When the price of crude falls sharply, inflation fears subside, calls for a Fed rate hike weaken, and cryptocurrencies tend to rally.
This move is supported by a decline in bitcoin and ether’s 30-day implied volatility, which measures market fear. Since the launch of spot ETFs two years ago, these numbers have moved toward VIX-like metrics, rising during sell-offs and easing as panic fades.
The mood could improve further later if Morgan Stanley’s Bitcoin ETF debuts with significant volumes and inflows on day one. This would strengthen the story of institutional adoption.
“The recent trend has been a resurgence of institutional demand through ETFs. When inflows are present, dips are bought more quickly and the market maintains higher levels even as momentum cools,” Marex said.
There are, however, reasons to be cautious. The overnight rally was partly fueled by the unwinding of short positions after traders betting on an escalation between the United States and Iran were caught off guard. According to Coinglass, shorts worth $431 million were liquidated in 24 hours, the most since March 4. In cases like this, the market often churns while waiting for new demand. Without it, the gains could quickly reverse.
Even though oil has fallen to $85, it is still $30 higher than before the conflict began on February 28. Furthermore, the ceasefire is temporary and not a permanent solution and for oil to continue to decline, Hormuz tanker traffic and insurance rates must normalize to pre-war levels.
“This remains a pause rather than a lasting settlement, with the ceasefire conditional on how Iran manages the passage through Hormuz over the coming weeks,” QCP Capital said. “This caution is important because the story of physical harm has not gone away.”
Until then, oil could stay near $100 and keep risky assets like crypto in check. Stay vigilant.
What is the trend
Effect of Iran ceasefire: Oil plunges as European markets jump (euronews): Oil prices plunged below $100 a barrel and European and Asian markets jumped after the United States and Iran agreed to a two-week ceasefire that includes the reopening of the Strait of Hormuz.
Dollar Hits Four-Week Low as Ceasefire Boosts Risk Appetite (Bloomberg): The greenback slipped as much as 0.97% to a four-week low as the deal sent Treasury yields lower, further reducing support. The South African rand and Swedish krona each gained around 2%.
European stocks climb 4% after US-Iran ceasefire deal; Travel Stocks Lead Gains Up 7% (CNBC): European stocks opened sharply higher on Wednesday. The pan-European Stoxx 600 index was up 3.4%, with all sectors except oil and gas in the green. Auto, mining and travel stocks led the gains, rising 5.6%, 6% and 7.3%, respectively.
A U.S. bank with $1.9 trillion in assets could launch its Bitcoin ETF on Wednesday (CoinDesk): The Morgan Stanley Bitcoin Trust could begin trading NYSE Arca under the ticker MSBT, Bloomberg ETF analyst Eric Balchunas said on X, a NYSE listing notice that indicates an April 8 launch.
Signal of the day
The chart shows daily Bitcoin price fluctuations in candlestick form since October. The yellow line represents the 50-day simple moving average (SMA) of the price and the white line represents the 100-day moving average.
As noted, the spot price moved significantly above the 50-day average, a widely watched measure of short-term trends. The move indicates strengthening bullish momentum and follows the recent rebound in trendline support from the February lows.
Prices could therefore see further upside, with $76,100, the 100-day average, as the next level to watch. On the other hand, the late March lows, near $65,000, should act as a demand zone, supporting pullbacks. If this level fails, prices could fall to $60,000.


