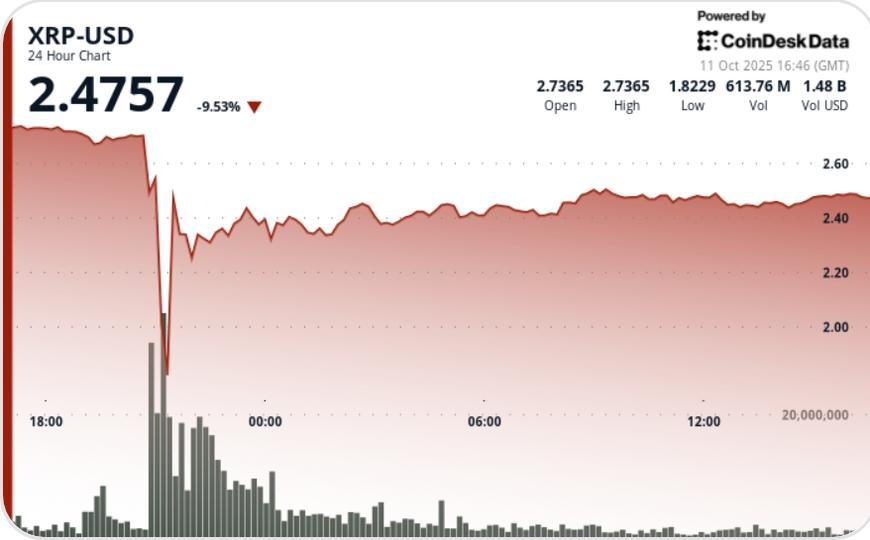
XRP recouped its losses during Friday’s chaotic trading, rebounding from a 41% collapse to close above $2.47 as institutional bids rebuilt after panic liquidations. The session’s $1.14 range – $2.77 to $1.64 – was one of the widest in XRP’s 2025 trading history, driven by macroeconomic deleveraging and strong futures selloffs across major platforms.
What you need to know
• XRP fell from $2.77 to $1.64 between October 10, 4:00 p.m. and October 11, 3:00 p.m., marking a 41% intraday collapse before rebounding to $2.49.
• More than $150 million in XRP futures were liquidated as Trump’s 100% tariff announcement sparked risk aversion across several assets.
• Intraday volume exceeded 817 million, nearly triple recent daily averages, as volatility peaked at 41%.
• Institutional accumulation between $2.34 and $2.45 as large holders rebuilt their exposure during the rebound.
• Key resistance remains at $3.05 with upward projections towards $3.65 to $4.00 if recovery momentum maintains.
News context
The sudden macroeconomic shock – new US-China tariffs – triggered forced sell-offs in risky assets. XRP briefly plunged to $1.64 before stabilizing as volume-weighted bids absorbed panic selling. Derivatives data confirmed the capitulation: open positions fell 6.3% overnight while long liquidations outpaced short positions 15:1. Analysts described the rebound as an “institutional recalibration” rather than retail-driven volatility, with Treasuries adding spot exposure to the $2.40 area amid an influx into ETFs and improving sentiment around Ripple’s banking integrations.
Price Action Summary
• The largest decline occurred between 7:00 p.m. and 9:00 p.m. UTC as XRP fell $1.08 on volume of 817 million – the capitulation candle of the week.
• The immediate rebound to $2.34 created a new base; the price then rose steadily to $2.49 at 15:00 UTC.
• The last hour (2:58 p.m. to 3:57 p.m.) saw a band of $0.03 ($2.46 to $2.49) with volume of 2.2 million — evidence of consolidation, not outflow.
• Reconstructed market structure with $2.47-$2.48 as near-term support, confirming absorption of prior volatility.
Technical analysis
• Support – $1.64 remains capitulation low; $2.40 to $2.45 forms an accumulation floor.
• Resistance – $3.05 remains the breakout trigger; a close above signals a structural recovery.
• Volume – 817 million versus 30-day average ≈ 270 million – capitulation level turnover.
• Model – Development of a bullish recovery channel; momentum indicators turn positive above $2.47.
• Trend – RSI recovered after oversold; The MACD histogram swings towards zero, showing an early reversal bias.
What traders are watching
• If the $2.47 area provides confirmed support during the weekend sessions in Asia.
• Continuation of offers from institutional desks after the liquidation phase.
• Flow data related to ETFs following the spillover from the launch of 21Shares TDOG.
• Technical breakout above $2.90-$3.00 to re-enter long setups targeting $3.65 and above.
• Macro risk narrative – tracking tariff hikes and crypto correlation spikes.


