The Meme coin consolidates quasi-psychological support while institutional flows and high trading activity suggest position building ahead of a potential breakout.
News context
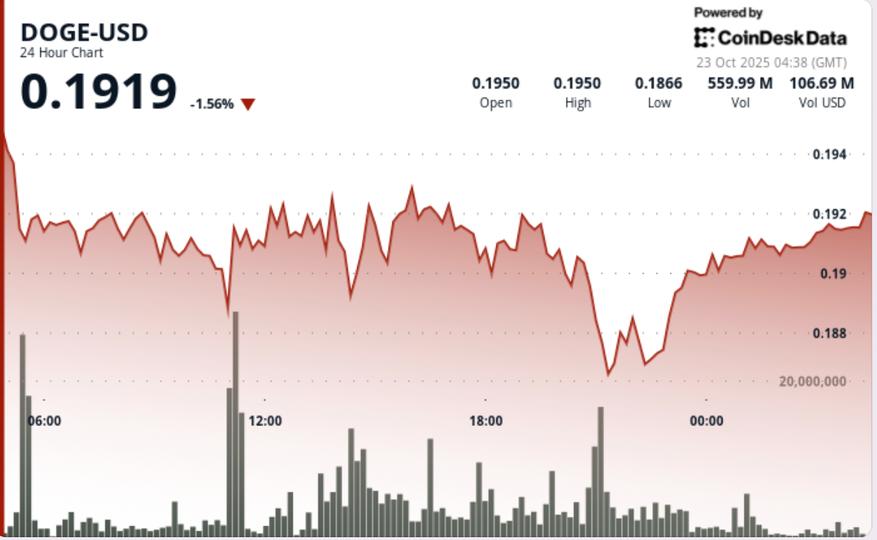
- Dogecoin fell 0.61% to $0.192 during Tuesday’s session, moving away from intraday highs of $0.195 as sellers capped their gains at resistance.
- The move follows Monday’s brief push toward $0.20, with traders citing consistent institutional profit-taking at the upper resistance levels.
- Despite moderate price action, trading activity soared 20.26% above the weekly average, with total turnover reaching 942.7 million tokens, approximately double the 24-hour average.
- The high volume, coupled with limited price movement, signals institutional accumulation rather than broad retail participation, suggesting positioning ahead of a possible breakout event.
Price Action Summary
- DOGE has been trading in a tight range of $0.0132, between $0.1860 and $0.1953 over a 24-hour period, holding near the psychological threshold of $0.19.
- The session’s volume peak at 942.7 million occurred as the token tested resistance at $0.1925 before reversing lower, confirming the near-term rejection.
- Support developed firmly around $0.1860, with repeated defenses throughout the mid-session window. During the last hour of trading, DOGE stabilized near $0.1916 following declining turnover, reflecting balanced order flow after earlier spikes in volatility.
Technical analysis
- The short-term structure of DOGE shows constructive accumulation forming under resistance. Hourly data reveals higher lows at $0.1914, $0.1916 and $0.1920 – confirming an ascending channel trend supported by institutional volumes exceeding 10 million per candle during recovery streaks.
- Immediate resistance lies at $0.1925, while broader trend caps remain at $0.2060 and the monthly Fibonacci level near $0.2663.
- The sustained squeeze between support at $0.1860 and resistance at $0.1925 highlights a tightening volatility band that typically precedes larger directional moves.
What traders are looking at
- Market participants are monitoring whether institutional flows maintain momentum above current volume thresholds.
- A clear break above $0.1925 could expose near-term targets near $0.20 to $0.21, while failure to hold $0.1860 support risks renewing downward pressure towards the $0.18 area.
- Traders identify continued divergence between rising volume and fixed price as a key accumulation signal – often a precursor to an expansion in volatility within 24 to 48 hours.


